In the era of information overload, capturing attention and conveying complex data can be a daunting task. Enter infographics – the dynamic, visually engaging medium that transforms data into compelling narratives. This blog explores the art and impact of infographics designs, delving into their significance, elements, and the creative process that makes them powerful tools for communication.
The Significance of Infographics Designs:
- Visual Appeal: Infographics leverage visual elements such as charts, icons, and illustrations to present information in a visually appealing and accessible manner. This aesthetic appeal makes data more engaging and memorable for the audience.
- Simplifying Complex Information: Whether explaining statistical data, processes, or comparisons, infographics simplify complex information. By breaking down intricate details into digestible chunks, they enhance understanding and retention.
- Enhanced Retention: Human brains process visual information faster than text. Infographics capitalize on this by combining text with visuals, leading to improved information retention and comprehension.
- Increased Shareability: The shareable nature of infographics makes them powerful tools for digital marketing. Their visually compelling format encourages sharing on social media platforms, expanding reach and engagement.
- Brand Recognition: Infographics designs offer an opportunity to reinforce brand identity. Through consistent use of colors, fonts, and visual elements, brands can create a distinct and recognizable visual language.
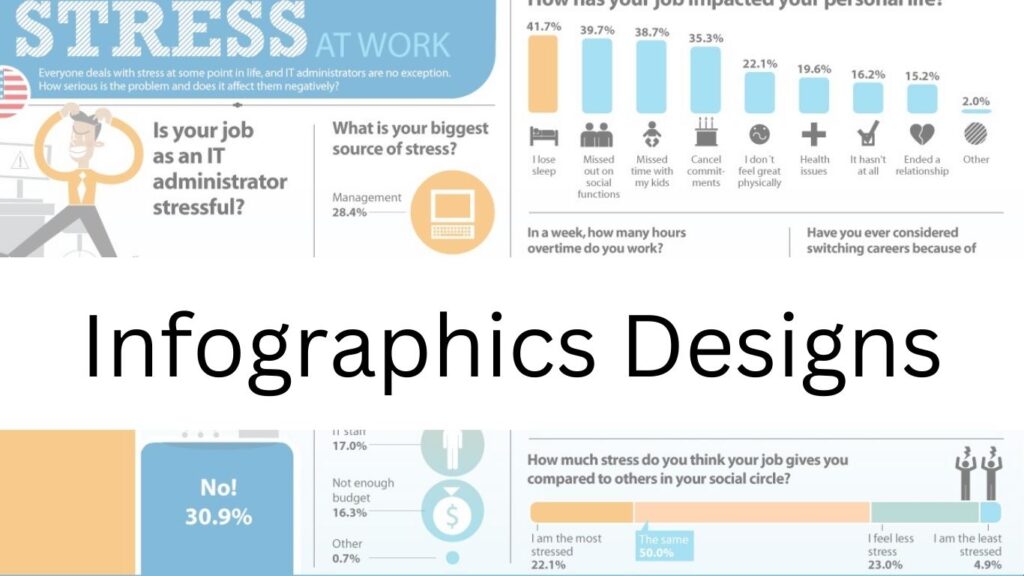
Elements of Effective Infographics Designs:
- Clear Structure: Well-designed infographics have a clear structure that guides the viewer through the information. They often follow a logical flow, making it easy for the audience to follow the narrative.
- Color Palette: Strategic use of colors enhances the visual appeal of infographics. Color choices should align with the brand or topic, creating a cohesive and visually pleasing composition.
- Engaging Visuals: Icons, illustrations, and images play a crucial role in infographics designs. These visuals not only break up text but also add context and interest, making the information more enjoyable to consume.
- Typography: The choice of fonts and text arrangement impacts readability. Infographics often utilize a combination of bold headlines, subheadings, and concise text to maintain a balance between information and aesthetics.
- Data Visualization: Charts, graphs, and other data visualization elements transform numbers into meaningful insights. These elements make statistical information accessible and compelling.
The Creative Process:
- Define Objectives: Start by clearly defining the objectives of the infographic. Whether it’s educating, entertaining, or promoting, a clear purpose guides the design process.
- Research and Data Collection: Gather accurate and relevant data. Infographics are only as effective as the information they convey, so thorough research is crucial.
- Storyboarding: Create a rough storyboard outlining the sequence of information. This helps in determining the layout and flow of the infographic.
- Design Software: Utilize graphic design software such as Adobe Illustrator, Canva, or Piktochart to bring the storyboard to life. These tools offer flexibility and a range of design elements.
- Review and Edit: Regularly review the infographic to ensure accuracy, clarity, and coherence. Edit text for conciseness and clarity while fine-tuning visual elements.
- Feedback Loop: Seek feedback from peers or stakeholders. External input can provide valuable perspectives and identify areas for improvement.

